Now it's time to get acquainted with some of the validation tools that
are available on the world-wide web. We shall use the PDB entry
1CBS as an example.
RCSB
Go to the RCSB page for entry 1CBS. Some of the information on
this page can be used for some "validation-lite":
- the resolution of the study
- the conventional and free R-value
- if, under "Experimental methods", there is a link to "Data"
it means that the authors have deposited
their experimental crystallographic data, which inspires
some confidence, but -more importantly- enables us to correlate
the model and the data ourselves
- the author list, journal and date :-)
If you click on the little document icon (next to the PDB code,
near the top of the page) and look at the
header of the PDB file, you may sometimes find a bit more detail about
the model, the data, and the refinement process (some of this information
you can also find under "Materials & Methods").
If you follow the link to "Geometry", you find more information about
the covalent geometry of the model. There is information about bond
lengths, angles and dihedrals (lots of grey, blue and green entries
in the tables are
good news; lots of red, pink and purple entries are not).
|
|
Fold Deviation Score display.
|
|
Q. 19. What are the values of Rfree
and of (Rfree - R) for 1CBS? Are these good or bad?
|
PDBe
Basic validation-related information is also available from the
Protein Data Bank in Europe (PDBe), on the
PDBe atlas page for entry 1CBS:
- the resolution of the study
- the conventional and free R-value (for most entries)
- if there is a link to download structure factors then that is
reassuring (see above)
- the author list, journal and date again :-)
PDBj
Basic validation-related information is also available from the third
partner of the wwPDB, the Protein Databank of Japan (PDBj). Check the
PDBj page for entry 1CBS. For instance, under
"Experimental details" you once again find the resolution limits and
the values of the conventional and free R-values.
Nowadays, PDBj also provides access to electron-density maps for a number
of entries. Unfortunately, whether or not you can view these maps is rather
critically dependent on the type of operating system and web browser that
you are using. You can try to look at the maps for 1CBS
here.
PDBsum
From the RCSB entry (under "Other Sources") and the PDBe entry (under
"Similarity") there are links to the
PDBsum pages for 1CBS where you find an
awful lot of information, spread out over multiple pages
(use the tabs at the top of the page). Relevant for validation
purposes are the following items:
- information about resolution, R and Rfree (top page)
- a diagram of the secondary structure. Usually, around 60% of all
residues in a protein is part of a regular secondary-structure
element (although there are exceptions) (protein page)
- a diagram ("LIGPLOT") of the interactions between the protein
and a ligand, retinoic acid. If the fold of a protein model is
correct, we expect that "sensible" residues will interact with
ligands, substrates, ions, etc. (ligands page)
- in the top page there is a link to "PROCHECK" (both
in the list of links under "Contents" on the left, and through
the miniature Ramachandran plot icon on the right) which provides
a summary of the results of the PROCHECK validation program
The PROCHECK results come in three parts:
- a Ramachandran plot
- statistics pertaining to the Ramachandran plot. A good model
would be expected to have > 90% residues in the core
allowed areas, and no more than 1-2% in the disallowed ones
- a list of G-factors (or Geometry-factors, so named in analogy
to crystallographic R-factors) that provide information as to
how unusual various aspects of the model are. Positive values
are good, but remember that bond lengths and angles are
usually restrained during model refinement (as opposed to
the phi, psi distribution)
|
|
PROCHECK Ramachandran plot. The red regions
are the core allowed regions. Additional allowed (by PROCHECK,
that is) regions are in brown, and generously allowed regions in
dark yellow. The disallowed regions are in a lighter shade of
yellow.
|
|
Q. 20. Are the interactions between the
protein in 1CBS and its ligand "sensible"?
|
|
Q. 21. Based on the PROCHECK output,
what do you think of the quality of 1CBS so far?
|
PDBreport
The PDBreport database contains quality analyses carried out with the
program WHAT IF (or, rather, a subset called WHATCHECK). It can be
reached via the "Other Sources" page of the RCSB entry, or via the
WHATCHECK link from PDBsum. At the top of the
PDBreport page for 1CBS there is a link to the
"Full report". On that page you will be presented with the complete
report from WHAT IF. This includes a large number of checks and tests.
For a description, look here, and for a discussion, look here.
The diagnostics come in three classes of severity:
- "note" - no problem, mon!
- "warning" - something requires your attention
- "error" - something appears to be seriously amiss
The most useful checks are:
- the Ramachandran plot
- several of the 3D-database-related checks (including the
packing scores, quality value plot, and rotamers)
- one or both summaries
|
|
WHAT IF Ramachandran plot.
|
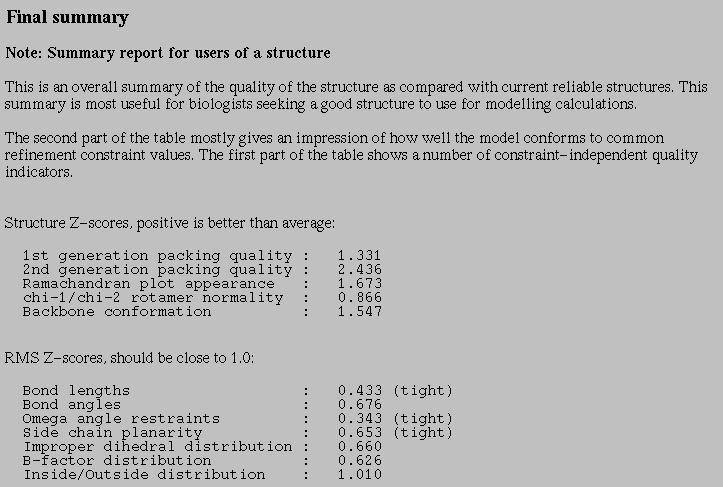
At the bottom of the output, there are two summaries, one for users of
a model (comparing the quality of this model to a set of high-resolution,
reliable models - this set changes over time), and one for the person who
deposits the model (comparing the quality of this model to a set of structures
solved at similar resolution). In particular the list of "Structure
Z-scores" of the first summary provides a quick overview of the overall
quality of the model.
|
|
WHAT IF summary intended for users of
a model.
|
|
Q. 22. Does WHAT IF detect any serious
problems in 1CBS? What do you think of 1CBS now?
|
|
Q. 23. Compare the numerical values
listed in the "Summary report for users of a structure" for
1CBS with the values listed in the figure above. Why have
some values changed during the time since the figure was
made (December, 2001) and the present report was generated
(date listed at the top of the report page)?
|
EDS
Finally, we shall have a look at EDS, the Uppsala Electron-Density Server. This
facility provides information about the model and its fit to the
experimental data (and, of course, electron-density maps).
Go to the EDS page for PDB entry 1CBS. Information about this entry
includes (click on the question mark images for more information about
individual items):
- in the summary on the right, the resolution etc. is listed
again. In addition, the R-value calculated by REFMAC (the program
used to calculate the electron-density maps) is listed.
In this case, this "R factor for map" is in fact lower than
the R-value reported (this may be due to a different selection
of reflections to include in the calculations, different
degrees of sophistication of the programs used now and then,
etc.). If the map R-factor is considerably higher than the
reported R-value, there may be reason for concern, though.
This box also contains some statistics that summarise the
results of the real-space fit calculations. The box below it
contains a few selected records from the header of the PDB
file that usually enable you to identify both the nature of
the molecule(s) in the PDB entry, and the authors.
- plots of the real-space (RS) fit (R-factor and correlation
coefficient) as a function of residue number.
If JavaScript is enabled in your browser, when you move the
cursor over the graph, the identity and real-space fit value
of each residue will be displayed. If you have a sufficiently
advanced Java plug-in,
a mouse-click will start up an interactive viewer that will
show you the residue you clicked on, its environment, and the
electron density in the neighbourhood. This is extremely
useful when you want to check that a particular residue
or part of the model that is important for your work has good
electron density (and is not a figment of the crystallographer's
imagination ...).
[Note: if you are familiar with a density-viewing
program such as O, Coot, Pymol or SwissPDBViewer, you don't
need to use the
EDS Viewer. Instead, you can download the electron-density
map and structure from the main page of each PDB entry (follow
the "All files (.tar.gz)" link), and inspect them with your own
viewer. Some programs can also retrieve data directly from EDS.]
- a plot of the occupancy-weighted average temperature factor
as a function of residue number.
- the link "Significant regions" gives you a plot that shows
residues that have considerably worse density than the average
for that residue type in structures at similar resolution.
This is derived from the "Z-scores" plot by only showing
residues that differ more than two sigma from the sample
average.
- the Ramachandran plot is included using yet another definition
of "good, bad and ugly", namely that of MOLEMAN2.
- various other bits and pieces of information that can be of
use to crystallographers, such as Yeates statistics and plot (that
can help you detect if the crystal was twinned), the Wilson B-factor
(which helps you judge if the average temperature factor is in the
expected ball park), and the completeness of the experimental data.
- some files for downloading onto your own computer (only of use
if you know what to do with them, of course).
- a set of links specific for this PDB entry, to resources that
provide information about the entry or its quality.
|
Q. 24. Which amino-acid residue in 1CBS
has the worst RS-fit value?
|
|
Attention Copenhagen students (January, 2009)!
Skip questions 25, 26 and 28.
|
|
Q. 25. Does it look as if the crystal
that was used for data-collection for 1CBS was twinned?
|
|
Q. 26. Do the temperature factors of the
protein and ligand in 1CBS strike you as reasonable?
|
|
Attention "O" users!
Download "All files (.tar.gz)" for this entry to a directory that
you own! Go to that directory, unpack the downloaded file
(tar xovpfz 1cbs.tar.gz), go to the new subdirectory
(cd 1cbs), and start up O.
Now inspect the density for the ligand, and that for some of the
residues that have a poor real-space fit according to EDS.
(Note: if you have problems downloading the .tar.gz file, try
this link instead.)
|
|
Q. 27. How good is the electron density for
the ligand in 1CBS, compared to that of the protein?
|
|
Q. 28. It has been suggested that residues
20, 29 and 30 change their sidechain conformations upon ligand-binding
to form a non-sequential/spatial Nuclear Localisation Signal. Inspect
the density for these three residues in both the apo structure (1XCA)
and the holo structure (1CBS). Are the changes in conformation supported
by the data (density)?
(PubMed)
|
Your own models
All the tools described so far contain pre-cooked information (although
it is sometimes generated on-the-fly) and only about models that have
already been deposited in the PDB. If you want to assess the quality of
a model that is not yet in the PDB, you can use a number of web-based
servers (also if you want to assess quality aspects that are not covered
by the resources discussed above). For more information, see the
Useful links page.


Practical "Model Validation" -
EMBO Bioinformatics Course -
Uppsala 2001 - © 2001-2009
Gerard Kleywegt
(Check links)
Latest update on 26 January, 2009.