Functional Genomics AND Proteomics
Outline
Proteomics. Protein chips. Array analysis. Mass spectrometry. 2D gel electrophoresis
Installing software
The specific software used along these practices is linked in the corresponding exercises. Some of them are portable application, but others may require typical installation. The software is optimized to run under Windows XP with Java Runtime Machine plug-in installed.
Exercises
1.- Magic Tools analysis of arrays
Practice 1.1: Use of the free software Magic Tools to analyze array data. Go to the following tutorial and answer the questions included.
Installation: Download Magic-Tools and extract in a folder (i.e.: \MagicTools). Run Magic Tools by double clicking "Magic_launch.bat". The last version of java runtime machine have to be installed. The program can also be run under Mac platforms. A complete tutorial is available here. To analyze array data we must follow several steps: Gridding, Segmentation, Expression data, Exploring and Clustering. The visualization can be accomplished with J TreeView.
Tutorial: Once the program is running...
- Create a new project: Project/New project and give
a name (*.gprj). Save in a folder (i.e.: \MagicTools\P1)
- Download input files [green4.tif;
red_4.tif,
4Grid_MT_genelist.txt;
yeastgenes.info]
and store in a folder
(i.e.: \MagicTools\P1\downloaded_files).
- Add files to the project: Project/Add file, and add files
previously stored in
\MagicTools\P1\downloaded_files. The files are now stored under
\MagicTools\P1 folder. Other new folders are
automatically created.
- Start the steps mentioned above.
GRIDDING:
- Load color images: Build expression file/Load image pair/Red
- Idem with Green image: Build expression file/Load image pair/Red
- Load the gene list: Build expression file/Load gene list
- Create and edit the grid: Build expression
file/Addressing/Gridding/Create/Edit Grid, and accept with OK
- Tell the program the setup grid: How many grids? (4 grids are loaded); Left to right, Top to
bottom & Horizontally, then OK.
Magic tools creates a grid from three points: the middle of "top left spot", the
middle for the "top right spot", and the middle of "any spot on the bottom row".
- Zoom in (over image)
- Set top left spot. Click on the spot (Move the percent of contrast change if necessary)
- Set top right spot
- Set bottom row
- Tell the program how many rows and columns in the grid
- Then update and see the grid.
- Move, resize or rotate to fit all the spots:
- Move: left click and drag the grid
- Resize: Small grey point in the corners
- Rotate: clockwise or counterclockwise
- Once you have the correct Grid#1, the go for the Grid#2 by
pressing Ctrl + click in the middle of the top left spot of Grid#2
- Repeat for Grid#3 and Grid#4
- Fit to screen, and Press Done!
- Finally save your data as *.grid
SEGMENTATION: EXPRESSION MENU:
- Creates the expression file segmentation: Build expression
file/Segmentation with different options
- Choose segmentation method [Check different possibilities]
-- Fixed circles (radius)
-- Adaptive circle (Min rad, max rad, threshold), or
-- Seed region growing algorithm (threshold)
- Choose ratio Method [Check different possibilities]
- Select Total (most usual)
- Scroll thorough the spots with Grid “number” (Prev or Next), Spot “number” (Prev or Next); also “jump to gene” or “jump to spot”
- Spots too dim or bright: Automatic flagging Options
- Keep all fields empty and press OK. This will calculate Summary
Statistics, which will help you to decide which parameters should be
written in Automatic flagging Options:
- Red foreground // Red background //Green foreground //Green
background
- [Be careful with the number of genes removed from the
calculation]
- See the “big picture” by Build expression
profile/Addressing/Gridding/Spot flagging [this shows the selected spots in the grids]
- Finally go to Create Expression File. This file contains the ratios of
red to green using the option set. Create two expression sets (exp1.exp
and exp2.exp) using two different option sets of options.
- Add filename: exp1.exp and exp2.exp
- Colum name (col1)
- Activate Create Raw Data
- Merge exp1.exp and exp2.exp: Expression/Merge expression file
[exp1_exp2_merged.exp]
- Get the average: Expression/Average replicates
[exp1_exp2_merged_avg.exp]
- Add gene annotation info: Expression/Import gene info.
-- Select info file "yeastgenes.info" [exp1_exp2_merged_avg_i.exp] Check added info in
Expression/View/Edit gene info
- Change gene name with aliases: Expression/Replace name with aliases
[exp1_exp2_merged_avg_i_ren.exp]
-
Manipulate data: Create logarithmic data in base 2, which is the most
common, to make induction and repression of genes easier to see:
Expression/Manipulate data/Transform/ (log) b=2
[exp1_exp2_merged_avg_i_ren_tlog2.exp].
--
Here positives (higher than 1)
are over expressed and negatives (lower than 1) are repressed genes.
- Standarize (set our data around 0):
Expression/Manipulate data/Standarize/ (set
mean to 0 and sd to 1) [exp1_exp2_merged_avg_i_ren_tlog2_std.exp]
-
Reorder columns: Manipulate columns Expression/ Manipulate
data/Reorder/delete columns
[exp1_exp2_merged_avg_i_ren_tlog2_std_limited.exp]
EXPLORING:
- Download and Work with
derisi_i.exp (with info
but not log transformed. All these procedures works also with log-transformed
data, but the input criteria must be different).
- These data come from the work from
DeRisi et al. (1997).
The authors studied the temporal gene expression accompanying the metabolic
shift from fermentation to respiration. Download the file and have a look.
- Examine derisi_i.exp using Expression/View Data, to be sure the
column labels are in the correct temporal order.
- Select Expression/Working Expression File/ and Select
"derisi_i.exp". Add file if necessary to select file.
- Go to Expression/Explore (check that the title of the window is derisi_i.exp,
having gene info but not log transformation)
* Question_01: How many genes' expression change by
at least a factor of 2 in the first two hours? (p. 680 from Derisi paper)
* Question_02: How many genes' expression are
greater than 2.0 or less than 0.5 in the time 0 microarray?
-- Find genes Matching criteria/
-- Find genes with a ratio above 2 or below 0.5 in colum t2
-- Enable criteria Value in column labeled [>2]
-- Enable criteria Value in column labeled [<0.5]
-- Group genes matching [any] (otherwise will be contradictory) then press OK
-- Group of genes found appear in red, which mean that we have not saved it. To
explore it later, save it as a group.
-- Save Group File/, and add a name ("group_1")
-- Do it again but with the following criteria: [>2.3, <0.1]. Save as group_2.
- Go to Explore then, View/Edit to see the genes in the group,
and add or remove genes from/to the group. If we change genes, we need to save
again the group.
-- Select existing group/and select "group_1"
-- Select Create Table. A table color-coded to the ratio values opens.
The table is gray-scale; with white is low ratio value. Change to red/green,
with green as low value. Now it is easier to see patterns. Decrease the line to
5 pixels per line, and Update Line Height
-- Move the slide bars down to near the bottom, since data cluster closer to 1
than to 20.
-- Go to Plot Selected Group. The graph shows the expression level of
the genes with time course. Select a gene by clicking over a point and see the
corresponding name in the window below. Expand the pane at the top of the window
and see the gene information. Zoom the graph by pressing Ctrl + drag area.
Close the window.
-- Select Circular Display to see how closely genes are related in
their expression levels (not recommended for large groups). Genes with lines
between them are considered closely related. If you click on a gene, it turns
yellow, and connected genes turn green.
The threshold to consider two genes closely related can be changed on the
Display/change threshold. The threshold is a measure of distance, defined
as (1-correlation). The scale is between 0 and -2, where 0 is perfectly
correlated and 2 is not correlated. Default is 0.2. Try a lower value.
-- Do a Box Plot. Red horizontal is the median; box represent the
quartiles.
* Question_03: How many genes' expression increases
by a factor of at least 4 sometime during the time course? How many genes'
expression diminishes by a factor of at least 4 sometime during the time course?
(p. 680)
- Find genes with a value greater than 4 in any column or a maximum value
greater than 4. Use the first criteria Max / value / >, and the OK.
- Save group. Plot Selected Group and identify the genes by click on
the plot. Expand the pane to see the name of the genes and additional info. Use
Shift key to select more than one gene.
- GO to Two Column Plot: compares ratios across two columns of data.
Pick two random columns. The first column is plotted along the x-axis, and the
second column along the y-axis. Each point is the corresponding gene coordinate
(x,y). The line is the regression line. Get the regression parameters from
Data/Regression data.
* Question_04: Investigate the change in expression
of ribosomal genes by forming a group of ribosomal genes, plotting the group,
and highlighting the mitochondrial genes in the plot. (p. 681)
The program assumes that the info file follow the standard gene ontology format.
Let’s look for genes containing “ribosomal”:
- GO to Find Genes Matching Criteria… (deactivate other options) /
activate Cellular Component / contains / ribosomal, and press OK.
- Save expression File / filename_i_clim.exp (clim stands for “criteria
limited”). Choose _ribosomal.exp instead.
-
Choose Now Open New Expression File and continue with the next question:
* Question_05: Using the file "derisi_i.exp" genes with the "late induction profile" described on p. 681, and graphed in Fig. 5B, in which levels increased by more than ninefold at the last time point (t12), but less than threefold at the preceding time point (t10). Compare your results to those in Fig. 5B, and use http://www.yeastgenome.org to help explain any discrepancies.
CLUSTERING:
Cluster data using hierarchical,
QT and Supervised
- Obtain dissimilarity data from
"Hypothetical_4grid.exp"
data: Transform the ratios to log in base 2 and then add genes info to
obtain "Hypothetical_4grid_log2_i.exp"
- Select Expression/Hypothetical_4grid_log2_i.exp and go to
Expression/Dissimilarities/Compute. Select (1-correlation)
- Load the Dissimilarity file: Cluster/Compute/Select a
Dissimilarity file/ "Hypothetical_4_log2_i.dis"
Hierarchical
- Select the clustering method: Cluster Method/Hierarchical cluster.
This method produces a tree-like structure by connecting genes according to the
similarity of their expression data. Select /Single Linkage and OK. The saved
file is "*_h.clust".
- Go to display cluster: Cluster/Display and select the generated
cluster. See the cluster information.
- In Hierarchical Display select Metric Tree. Now we can see the tree
structure of the clusters against the metric at the top. If you click in a node,
all the sub nodes will become highlighted and you can plot them. Try selecting
and plotting a node.
- Now try the Exploding Tree, which allows you to show the clusters by
gradually expanding the contents of each node. - If you click on a node number
and press Explode, all branches will be displayed.
- Finally Tree/Table combines colored tables with the tree. The tree is
formed on the left side, and genes are sorted by clustering. Change line
Height by 3 and Update Line Height.
- Change color scale and scroll the panel to see the patterns that appear in the
color of the table.
* Question_06: Cluster the genes in to groups with
similar patterns. Use the (unsupervised) QT clust method with a threshold of 0.3
and maximum number of clusters 20.
QT Clustering
- Go to Cluster/Compute/Select file and then select QT Clustering.
The generated file is "*_q.clust". After computing, select
Cluster/Display and select the new file.
- Press List. The base gene of each cluster is displayed on the left,
sorted by size with the largest cluster on top. If you click on a base gene, you
can see the elements in the cluster, the dissimilarity between the base gene and
the element, as well as the number of elements in the cluster. You can click
Plot Cluster as a Group and the entire cluster is plotted. You can also
click on an element in a cluster, and press Plot Cluster as a Group;
the element and all elements above it in the cluster are plotted.
- The Exploding Tree button shows the list of clusters. There are NO
sub-clusters. QT clustering does not create nested clusters or a tree hierarchy
like hierarchical clustering.
The Tree/Table is similar to Hierarchically, except for the tree in the
left, which are numbers. These values are the dissimilarities to the base gene
of the cluster (in the top) which has a dissimilarity of 0.0 with itself. If you
scroll down the table you can see color patterns. A horizontal line in the left
column (and another 0.0 value) denotes the split between clusters.
* Question_07: Form a supervised cluster with SAM1
(YLR030W) as the seed, and compare your results to Fig 5E; (i) using 0.2 as the
threshold; and (ii) using 0.02 as the threshold.
Supervised Clustering
- Go to Cluster/Compute/Select file and then select Supervised
Clustering. The generated file is "*_s.clust". Supervised
clustering performs a QT cluster, but you can define the threshold and choose
one gene around which you want your cluster built. This allows you to focus your
research on your favorite gene (i.e.: YDL036C).
- Press List and see that there is only one cluster. Click on it and
see the list of genes clustered around the selected gene with specified
threshold.
- We can also create an imaginary gene: Create Gene (first unclick Use
Existing Gene). The sliders specify the expression level of our imaginary gene
in each column. The column labels are shown above the sliders. They are
currently set at the mean expression level of each column, and the actual
expression level selected is shown in small text below each slider.
- We want to find genes that have no change at 0, are up at 10, 20 and 30, down
at 40, 50, 60, and 70, up again at 80 thorough 120, and have no change at 130.
Set the sliders to approximate the expression levels for which we want to
search.
- Now the program has created a cluster. Change the name under Cluster File in
order to avoid overwriting the previous calculations (Hypothetical_4_log2_is_created.clust).
- Then display the created cluster: Cluster/Display/options… in a
similar way to QT clustering. Check List. There you have the list of
gene than closely resembled the searched pattern. Try to plot the group. Notice
that the pattern resembles the created gene. If we decrease the threshold, the
matching would become stricter, fewer genes would be allowed in the cluster, and
we would see a plot that is much tighter and more closely matches what the
imaginary gene.
GENERATE A J_TREE_VIEW DENDOGRAM
- Compute a hierarchical cluster
- Go to Cluster/Create dendogram with JTreeView
- Choose a hierarchical cluster and Export
- The tree is on the far left and the colored table is to its right. If you
click on a gene on the table you will see an expanded, labeled version of that
gene’s expression profile, appearing in the third pane, and the genes’s info
appears in the far right pane. You can also drag a set of genes. Click over a
gene in the third panel and get the information in the view Status windows
(upper left corner). If you click on the genes info (right panel) your default
web browser will try to open a page containing information about that gene in
any database.
- Another feature of JTree View is a karyoscope, which displays the expression
level of each gene at its location along its chromosome.
* Question_08: Locate cluster of the gene YDL036C
and propose a relation with other genes within the cluster, as well as a role
(if possible) for this gene. Check all clustering method an take advantage of
the JTreeView.
- Open generated trees: File /Open/*_ih.cdt then
- Analysis/Karyoscope. Red values at a particular location point up.
Green value point down, and the length of the line is representative of the
expression level. The blue mark is the centromere.
- Drag and zoom over a chromosome. Point over a gene. All data is displayed in
the upper right corner of the window.
You can also change the column that is displayed by choosing column label of the
column you want to see from the Experiment dropdown.
2.- Mass spectrometry and 2-D gel electrophoresis
Practice 2.1: Observe how one type of mass spectrometer works. Electrospray source, Ion Trap analyzer: LCQ and ESI Ion Trap System.
Tricks:
Download this file and execute to observe how an instrument works.
Practice 2.2:
Find the theoretical MW of a known protein. Compare theoretical to observed. Browse information and view structure.Tricks: Open an internet browser, go to the
Expasy Proteomics Server
Select UNIPROT-KB database and type "alkaline phosphatase ecoli". This will
result in information about protein precursor (P00634). Explore the information
(Feature Table, amino acid sequence). Under Sequence paragraph, Select Computer
pI/Mw. Select residues 22-471 (this is the protein without signal). This will
provide information about the protein's average MS. Compare the mass spectrum
(below) to the theoretical average MW. Calculate the m/z difference and % error
between the observed and theoretical protein. MALDI-TOF spectrum of alkaline
phosphatase:
To view the structure of this protein, open a new browser page, go to the Protein Data Bank. Search the Archive for "Alkaline phosphatase e.coli", type in the ID number, do a full text search: (P00634). Select Search and select any of the structures listed. Under DISPLAY OPTIONS select a viewer. Explore the information provided by this page. Try other proteins, use the "search" option on the left side of the main page, select browse database and select any section, then any protein.
Practice 2.3:
Visiting 2D databases. Explore information on a 2-Dimensional gel from yeast Glyceraldehyde 3-phosphate dehydrogenase.Tricks: Go to Expasy and select SWISS-2DPAGE (under databases). Choose access to Swiss 2D page by accession number. Search for P00359 (Glyceraldehyde 3-phosphate dehydrogenase from yeast). Enlarge the gel and notice where the spot is observed. Return to SWISS-2DPAGE, and choose access by clicking on a spot. Find the gel for yeast (Saccharomyces cerevisiae) and try to find the same protein.
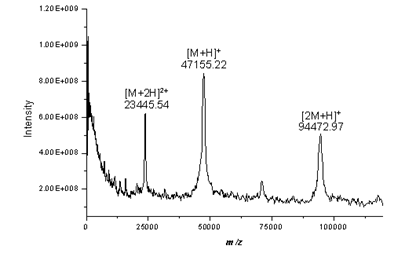
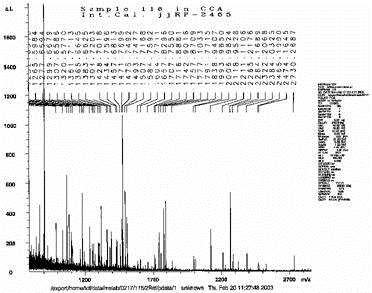
Practice 2.4: Investigate peptide mass mapping used for protein identification
MALDI-TOF spectrum of tryptic peptides from Unknown protein #116
(a) Identify a protein from measured peptide masses
Tricks:
- Open the excel spreadsheet
provided. Use only
the tabs labeled 66, 116, 55, 36.
- Copy and paste the m/z values into the search described below.
- Delete the m/z values 904.4681 and 2465.199 (these are internal calibrants)
- Identify unknown protein #66 using the excel data.
- Identify protein from other unknown proteins (#116, 55, 36) as time permits.
- Open an internet browser and go to
prospector.
- Select MS-Fit program
- At the bottom of the screen is a data paste area filled with masses.
- Delete these and copy/paste the mass list from the excel spreadsheet.
- Search these masses while changing different options.
- Options to vary: (Database (swiss-Prot, Owl, NCB), Mass tolerance (50, 70,
100, 120 ppm)
- Look for proteins with strong MOWSE scores with low mass errors.
(b) Find a protein's theoretical peptides to confirm the identity
Tricks:
-
Open an internet browser and go to
Prospector.
- Select the MS-Digest program
- Options to choose:
-- Retrieve entry by accession number (Enter a number for the protein identified
in #3a [[P00359]])
-- Select the database where your protein was found
-- The digestion enzyme is Trypsin, with 0 missed cleavages
Practice 2.5: Investigate the use of MS-MS data for peptide sequence information (and ultimately protein identification). An unknown protein was digested with trypsin and MS-MS spectra was acquired. A list of fragments from one of these peptides is included in the excel spreadsheet (fragments 316-318).
Tricks:
- Go to protein
Prospector and
select the MS-Tag program.
- Copy/paste the mass list, overwriting the default masses on the program.
- First on the list should be the mass of the selected peptide (this may need to
be calculated)
- Search for possible peptides/proteins.