
|
||
|
|
||

|
First we will go back to basics and wonder what structures are and why we determine them. If you have a reasonable knowledge of structural biology already, you can skip this page! (Although you will probably want to have a look at the three movies at the bottom of this page anyway ...)
|
Attention Copenhagen students (January, 2009)! This page is optional - it summarises things most of you probably already know. (But check out the movies at the bottom of this page anyway!) |
There are actually different levels of structure:
A propos the concept of "resolution": crystallographers tend to quantify the resolution of their models based on the quality and quantity of their experimental data. You should remember that small numbers signify high resolution and vice versa. For instance, 4 Å is considered low resolution for a crystal structure, whereas 1 Å is very high resolution!
The knowledge we gain from structure determination finds many applications. Understanding a structure (apart from satisfying our intellectual curiosity) usually allows us to explain or interpret previous experiments (pertaining to activity, specificity, effect of point mutations, etc.), and it sometimes enables us to suggest further experiments to answer yet other questions. In other cases, it enables us to suggest alterations in natural systems (e.g., a point mutation to improve the thermostability of an enzyme) that improve such systems or at least modify them in a predictable (we hope ...) fashion. Alternatively, we may be able to design compounds that interfere with a natural system or process (e.g., a compound that binds to and inhibits an enzyme that is crucial for the survival of a pathogenic bacterium).
Since the work of Anfinsen (PubMed) we know that protein structure is determined by the amino-acid sequence. Unfortunately, we still don't know the "rules" that Nature uses to determine structure from sequence (it's a pretty safe bet to assume that there's a Nobel Prize waiting for you if you manage to solve this "protein folding problem"). In addition, structure is modulated by the environment (pH, solvent, temperature, ...) and by interactions with other (small and large) molecules (substrate, inhibitor, ion, DNA, ligand, ...). Furthermore, the picture is complicated by metal ion centres, chaperones, isomerases, oligomerisation, domain swapping, glycosylation, etc. And even if none of these factors play a role, there is still the fact that proteins are not static entities. At temperatures above absolute zero, there is always thermal motion of the atoms.
You might counter that proteins are just simple organic molecules (except more so), and since we know the typical values for single carbon-carbon bond lengths, etc., we should be able to calculate an approximate structure by simply using typical bond lengths and bond angles. Unfortunately, the information contained in protein structures lies essentially in the conformational torsion angles. Even if we assume that every amino-acid residue has only three such torsion angles (phi, psi and chi-1, say), and that each of these three can only assume one of three "ideal" values (e.g., 60, 180 and -60 degrees for chi-1), this still leaves us with 27 possible conformations per residue. For a typical 200-residue protein this works out to 27200 which is roughly 1.87 * 10286 possible conformations. But can't we just generate all these conformations, calculate their energy and see which conformation has the lowest energy ? Well, even if we had a perfect force field (a way to calculate the energy of the protein), and if we were able to evaluate 109 conformations per second, this would still keep us busy 4 * 10259 times the current age of the universe (give or take a day or two).
There are cleverer ways to predict protein structures without collecting large amounts of experimental data. If a protein's sequence has more than ~40% identical residues to the sequence of another protein whose structure is known, then a reasonable model can often be generated using so-called homology modelling (a.k.a. comparative modelling) techniques. At lower levels of sequence identity other techniques (fold recognition through threading or profile methods, and entirely ab initio predictions) can be used, but the results on the whole are still rather poor. (See the results of the biannual CASP meetings.)
However, none of these techniques allow us to directly calculate "the structure" from the data. In the case of X-ray crystallography one obtains the distribution of the electrons (rather than the nuclei), and the major source of information obtained from NMR experiments concerns limits on the distances of pairs of protons (hydrogen-atom nuclei). This means that there is always an element of subjective (and error-prone) interpretation of the experimental data that leads to a model - a hypothesis of the structure that gave rise to the experimental data that we collected. This is also the major reason why validation of such models is very important.
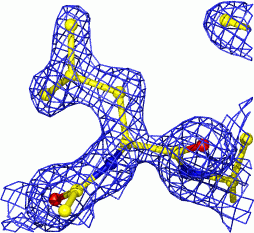
In the case of X-ray crystallography, one obtains a so-called electron-density map - the distribution of the electrons in space. Where there are many electrons (and, hence, heavier atoms) the density is higher than in places where (on average) there are few electrons.
 |
In recent years the initial crystallographic model-building process has been partially automated. If good high-resolution data is available, these methods can build almost complete models without human intervention. However, many interesting proteins and complexes do not crystallise in such a way that high-resolution data can be collected. In general, the model-building process becomes more and more difficult as the resolution of the data becomes lower. Simultaneously, the probability of making mistakes increases at lower resolution.
Another (more technical) problem that complicates model building is that of phase error. In short, there are two parts to the quantities that are needed to calculate the electron density, but only one of these (intensity) can be measured. The other (phase) has to be derived somehow (don't worry about the "somehow"). Unfortunately, the impact of these phases on the appearance of the electron density is much greater than that of the intensities (see the "Animal Magic" in Kevin Cowtan's Book of Fourier). In fact, with perfect phases, even at ~4 Å resolution map interpretation would not be a major problem (indeed, this situation often arises in the study of viruses).
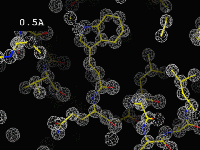 |
The effect of resolution"This movie displays a calculated electron density map, contoured at 1 sigma, as the resolution limit is adjusted slowly from 0.5Å to 6Å. [...] The phases are perfect, and so are the amplitudes (R-factor = 0.0%) for all the resolutions displayed. Note that, even for a perfect map, you expect side chains to poke out of density at 3.5Å."(Click on the image to start the movie. If it doesn't load or is very slow, you can also try the original version.) |
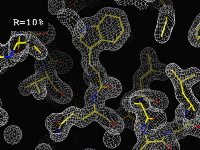 |
The importance of amplitudes"This movie displays the effect of calculating a map with "wrong" amplitudes. [...] The images in this movie represent the slow changing of all the amplitudes to a different set of randomly selected values while holding the phases constant. It is interesting to note that the map hardly changes at all until the R-factor gets higher than 30%. The maximum R-factor you can get for two random data sets is 75%, which is the end of the movie. Kinda spookey how it still looks traceable, isn't it? The resolution here is 1.5Å, and the phases are always perfect."(Click on the image to start the movie. If it doesn't load or is very slow, you can also try the original version.) |
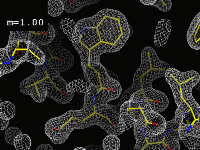 |
The importance of phases"This movie displays the effect of calculating a map with "wrong" phases. The "figure of merit" (cosine of the error in the phase) is displayed as "m". The images in this movie were calculated by merging a perfect calculated map with another map, calculated with the same amplitudes, but with phases obtained from a model with randomly positioned atoms. Merging these two maps always preserves the amplitudes, but changes the phases slowly to a new set of values. At what point do you think the map becomes untraceable? The resolution here is 1.5Å, and the R-factor is always 0.0%."(Click on the image to start the movie. If it doesn't load or is very slow, you can also try the original version.) |
![]()
![]()
Latest update on 26 January, 2009.
![]()